What Makes the 'Dream Team' in MLB - Identifying Key Batting Metrics that Drive Offensive Production in the Statcast Era (2015-2024)
Abstract
This study examines the relationship between various batting metrics and team run production throughout the Statcast era (2015-2024). The analysis of team-level offensive statistics for all 30 MLB teams reveals that traditional metrics—particularly walks (BB) and home runs (HR)—maintain the strongest correlations with run production, while advanced Statcast metrics show weaker relationships than initially hypothesized. Regression analysis demonstrates that traditional statistical models outperform Statcast-based models in predicting team run totals. These findings suggest that front offices should maintain a multidimensional approach to offensive evaluation rather than overemphasizing either traditional counting stats or advanced physical metrics in isolation.
Introduction
Baseball has long been intertwined with statistics, perhaps more than any other sport. As Oakland Athletics General Manager Billy Beane famously stated in Moneyball, “Your goal shouldn’t be to buy players, your goal should be to buy wins.” This philosophy revolutionized baseball operations to emphasize that statistical analysis could help us recognize undervalued attributes that translate directly to team success. The quest to identify which player attributes genuinely contribute to winning has driven decades of analytical innovation, with each new technological advancement offering deeper insights into team building strategies.
In 2015, Major League Baseball introduced Statcast, a state-of-the-art tracking system that fundamentally transformed baseball analytics. Statcast uses radar and optical tracking technology to provide unprecedented data on previously unquantifiable aspects of player performance, such as exit velocity (the speed at which the ball leaves the bat), launch angle (the vertical angle at which the ball is hit), barrel percentage (optimally struck balls), and hard-hit percentage (balls hit at 95+ mph). This technological revolution was a significant milestone in baseball’s analytical evolution and had already progressed from basic counting statistics to sophisticated metrics over the previous decade. Despite these advancements, questions remain about which batting statistics, both traditional and advanced (Statcast), most consistently translate to team offensive production (total runs). As Wulff (2022) noted, “statistics measure different aspects of hitting that cannot be captured in a single sabermetric” (p. 95), highlighting the multidimensional nature of offensive metric and the challenge of identifying which metrics are most valuable for predicting run production.
This research examines the relationship between various batting metrics and team run production throughout the Statcast era (2015-2024) by analyzing team-level offensive statistics for all 30 MLB teams. The dataset includes traditional metrics (batting average, on-base percentage, slugging percentage, home runs, walks, and strikeouts) alongside Statcast metrics (exit velocity, launch angle, barrel percentage, and hard-hit percentage). Using correlation analysis, multiple regression modeling, and longitudinal trend analysis, this research identifies which metrics most consistently predict total run scored and how these relationships have evolved since Statcast’s introduction. The analyses reveal that traditional metrics, particularly walks (BB) and home runs (HR), show the strongest correlations with run production (r = 0.890 and r = 0.875, respectively), while advanced Statcast metrics show weaker relationships than initially hypothesized. Furthermore, regression analysis demonstrates that traditional statistical models outperform Statcast-based models in predicting team run totals, with an R-squared value of 0.955 for the traditional model compared to significantly lower values for Statcast-only models. These results have important implications for how MLB teams should evaluate offensive talent and construct lineups to maximize run production in the Statcast era.
Literature Review
The evolution of baseball analytics has been a progressive integration of traditional and advanced metrics rather than replacing old metrics with new ones. This historical context is crucial for understanding current debates about batting metrics and their effectiveness in predicting offensive performance. Baumer and Zimbalist (2014) describe the analytical evolution of baseball from basic counting statistics to complex metrics, explaining the gradual acceptance of sabermetrics in MLB front offices and laying the foundation for today’s data-driven approach. This evolution has been accompanied by changes in batting strategies, and Wulff and De Silva (2022) noted that “statistics measure different aspects of hitting that cannot be captured in a single sabermetric” (p. 95). Their research shows the multidimensional nature of hitting through Pareto optimization and shows how metrics such as batting average (AVG), on-base percentage (OBP), and slugging percentage (SLG) capture different performance aspects. The multi-criteria approach they propose offers advantages by “allow[ing] the trade-offs among the criteria to be compared” (p. 85) without “having to combine multiple criteria into single metrics based upon complex specifications for weighting and scaling” (p. 85). Complementing this work, Albert (2016) takes a decomposition approach to break down aggregate statistics like batting average into its constituent rates, such as strikeout rate, home run rate, and batting average on balls in play (BABIP). He argues that “by estimating the component rates separately using Bayesian exchangeable models and aggregating the component estimates, one obtains estimates of hitting talents that give better predictions than standard ‘shrinkage’ estimates of batting averages” (p. 74). This indicates that certain metrics (e.g., BABIP) are more influenced by chance than others (e.g., home run rate).
Advances in statistical techniques have greatly improved our understanding of predicting batting performance. Albert (2016) developed Bayesian random effects models that leverage the natural decomposition of batting performances into multinomial data (strikeouts, home runs, hits in play, and outs in play). His ‘separate and aggregate’ approach provides superior predictions of batting averages for a following season compared to traditional shrinkage methods. The greatest improvement was observed when predicting extreme batting averages. Based on this methodological evolution, Wulff and De Silva (2022) use Multivariate Analysis of Variance (MANOVA) techniques with parametric bootstrapping to develop future performance predictions. They point out that this uncertainty can be “propagated to the Pareto optimal sets and to the scored rankings for predicting performance results in an upcoming season” (p. 97), integrating factors like team, fielding position, batting side, and games played to demonstrate the complex interplay of variables influencing batting performance. Baumer and Zimbalist (2014) document the transition from simple regression models to more complex approaches in baseball analysis, highlighting both the successes and limitations of statistical modeling. Their work explains how teams have integrated these models into their decision-making processes and provides important historical context for understanding today’s predictive models.
Physical abilities and anthropometric characteristics have a clear relationship with batting performance, especially as captured by advanced tracking metrics. Kohn et al. (2024) found that anthropometric features accounted for “29% of variance in ZCP [Zone Contact Percentage] and 50-55% of variance in HHP [Hard Hit Percentage]” (p. 725) among collegiate baseball players. According to their research, adding physical assessment data to anthropometric features improved prediction models, especially for hard-hit percentage, where assessment data accounted for an additional 5-12% more variance (p. 31). Their findings showed that “CMJ peak power, height, weight, and dominant hand grip strength were the top-4 features that contributed to HHP” (p. 724), highlighting lower-body power and grip strength’s importance in making hard contact. Interestingly, they found that players with greater lower-body power had poorer ZCP (p. 723), suggesting potential trade-offs between contact ability and power generation. Conversely, the fact that “players with greater lower-body power and higher hand grip strength had a higher proportion of hard-hit balls than smaller, lighter, less powerful players” (p. 724) indicates that the relationship between physical strength and power-based metrics is more direct. Lindbergh and Sawchik (2019) explore how teams and players have revolutionized development approaches through data-driven methods, examining how advanced metrics influence training techniques, particularly regarding swing mechanism modifications based on launch angle and exit velocity data. Their work documents numerous player case studies that transformed their careers by embracing analytical approaches, demonstrating the practical application of batting metrics in player development.
The relationship between batting performance, player value, and compensation is an important area of study in baseball economics. Pinheiro and Szymanski (2022) examined the labor market efficiency in MLB through run value contributions and developed an approach based on run expectancy which “allows [them] to structurally determine the value of specific events in baseball, based on each event’s contribution to runs” (p. 1048). This method provides more granular analysis than previous studies that focused on composite statistics like OBP and SLG. According to their research “the compensation of free agents reliably reflects the run value contribution of each player, regardless of the source of those contributions (walks, singles, and home runs)” (p. 1046). This refutes previous studies that claimed market inefficiency before Moneyball was published. Their analysis of 1996-2015 data indicates that “the labor market for batters in Major League Baseball operated efficiently across [their] entire sample period” (p. 1046), with teams properly valuing different batting outcomes based on their contribution to run production. They also mention that different batting events have stable run values over time: “While the aggregate production of particular events may have changed over time… the frequency with which particular events are converted into runs has remained very stable over this period” (p. 1057). This stability suggests the underlying values of the various batting outcomes in producing runs remain consistent, even as the way baseball is played has changed. Lindbergh and Sawchik (2019) complement this economic analysis by documenting how teams have integrated advanced analytics into player acquisition strategies, highlighting cases where organizations identified undervalued skills before they became widely recognized.
While batting metrics have advanced significantly, gaps remain in our understanding of how these metrics translate to team-level offensive production over time. Researchers such as Albert (2016) have developed predictive models of individual hitting performance, and Pinheiro and Szymanski (2022) have examined their impact in the labor market, but few studies have comprehensively analyzed specific hitting metrics that most reliably predict team run production over multiple seasons. In addition, there has been limited research examining how the relative importance of various metrics has changed since the introduction of Statcast in 2015. This gap is important because team construction decisions are ultimately aimed at maximizing the performance of the group rather than individual statistics. My research aims to identify the offensive metrics that have most consistently led to team offensive productivity across the Statcast era, both in terms of traditional and advanced metrics, to provide useful insights for team management and strategy development to help bridge this gap.
Discussion
The comprehensive baseball dataset used in this study provides a foundation for investigating the relationship between batting metrics and offensive productivity. This dataset includes both traditional and advanced Statcast statistics for all 30 MLB teams, collected from FanGraphs. Rather than relying on a single-season snapshot, this data includes batting statistics across 10 seasons (2015–2024), thereby enabling a robust analysis of which metrics are consistently correlated with offensive production.
To analyze the relationship between batting metrics and run production, I took a three-step approach. First, I calculated Pearson correlation coefficients between each metric and team runs scored to identify the strength and direction of these relationships. As shown in Figure 1, these correlations varied considerably across metrics, with traditional statistics generally showing stronger relationships with run production than Statcast metrics.
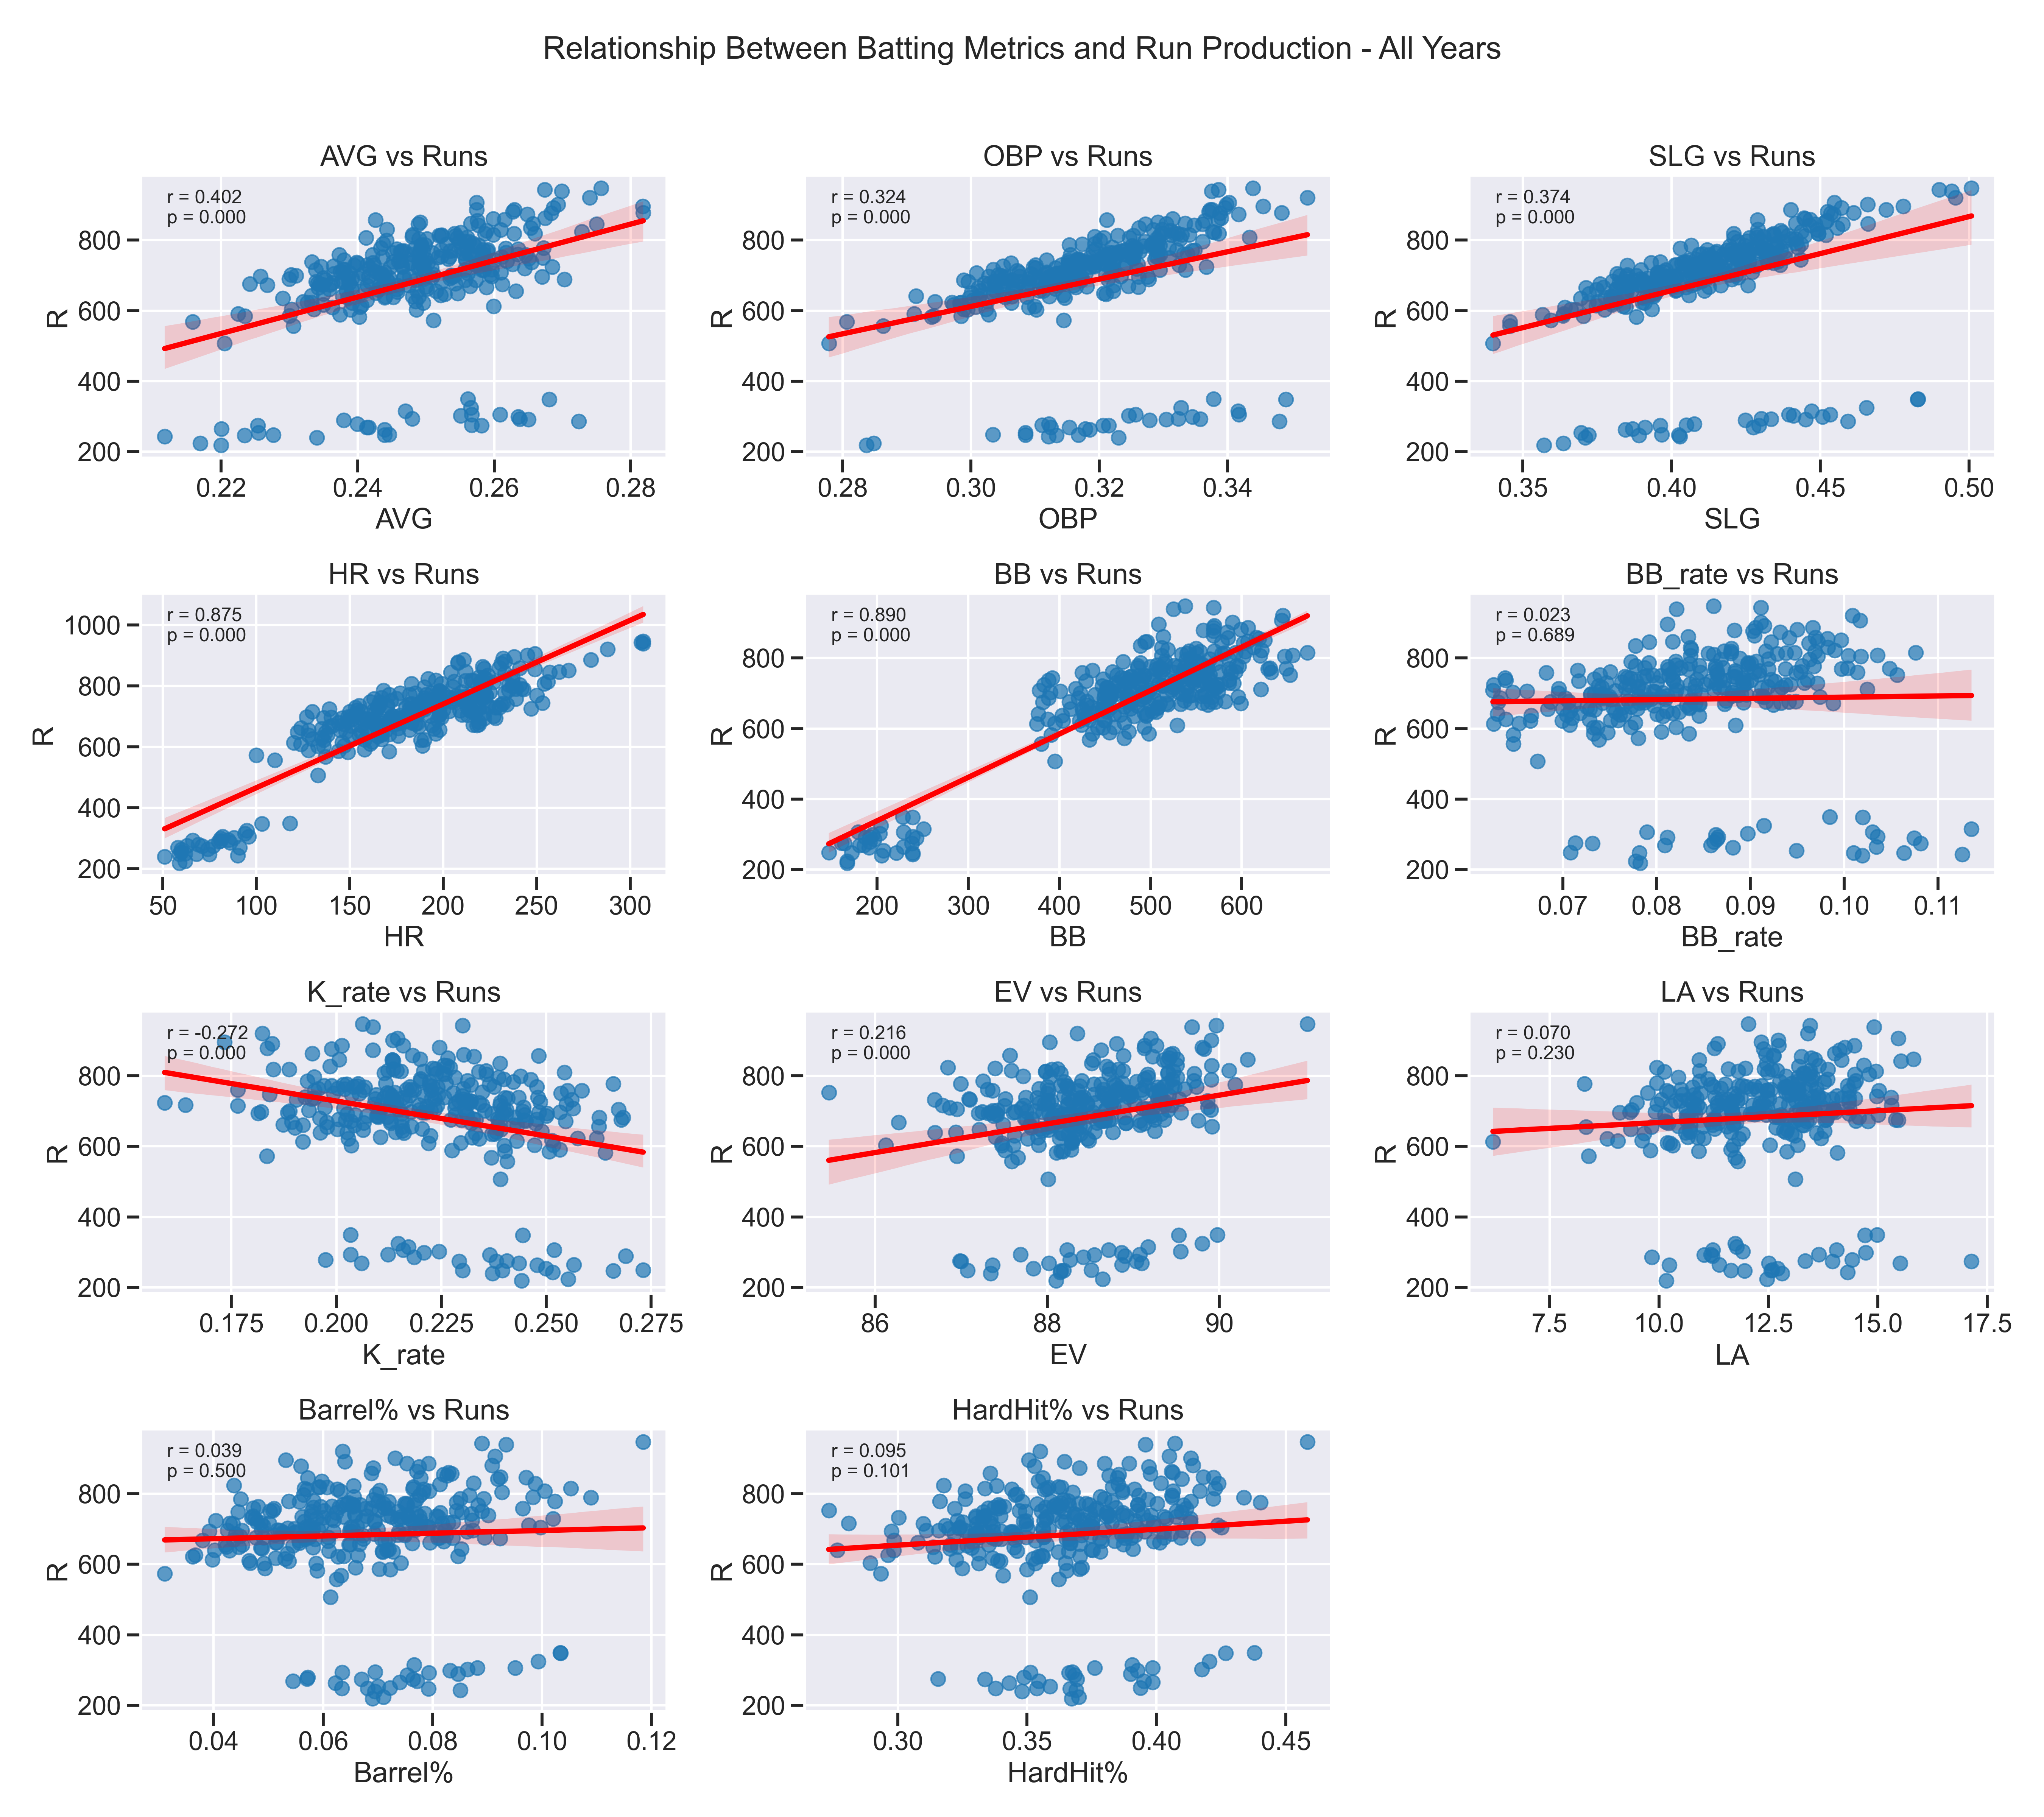 Figure 1: Relationship Between Batting Metrics and Run Production - All Years
The correlation scatter plots reveal that walks (BB, r = 0.890) and home runs (HR, r = 0.875) have the strongest linear relationships with total runs scored, while batting average (AVG, r = 0.402), slugging percentage (SLG, r = 0.374), and on-base percentage (OBP, r = 0.324) show moderate correlations. In contrast, Statcast metrics demonstrate notably weaker relationships: exit velocity (EV, r = 0.216), hard-hit percentage (HardHit%, r = 0.095), barrel percentage (Barrel%, r = 0.039), and launch angle (LA, r = 0.070) all show minimal correlation with run production. These results clearly indicate that despite the technological sophistication of Statcast measurements, traditional outcome-based statistics remain more directly tied to offensive production.
The second stage of analysis was developing multiple regression models to identify which combination of metrics best predicts team run totals. Three distinct models were created: one using only traditional metrics, one using only Statcast metrics, and a combined model. Figure 2 illustrates the evolution of model performance across the Statcast era. It shows that the traditional metrics model consistently outperformed the other approaches throughout the study period.
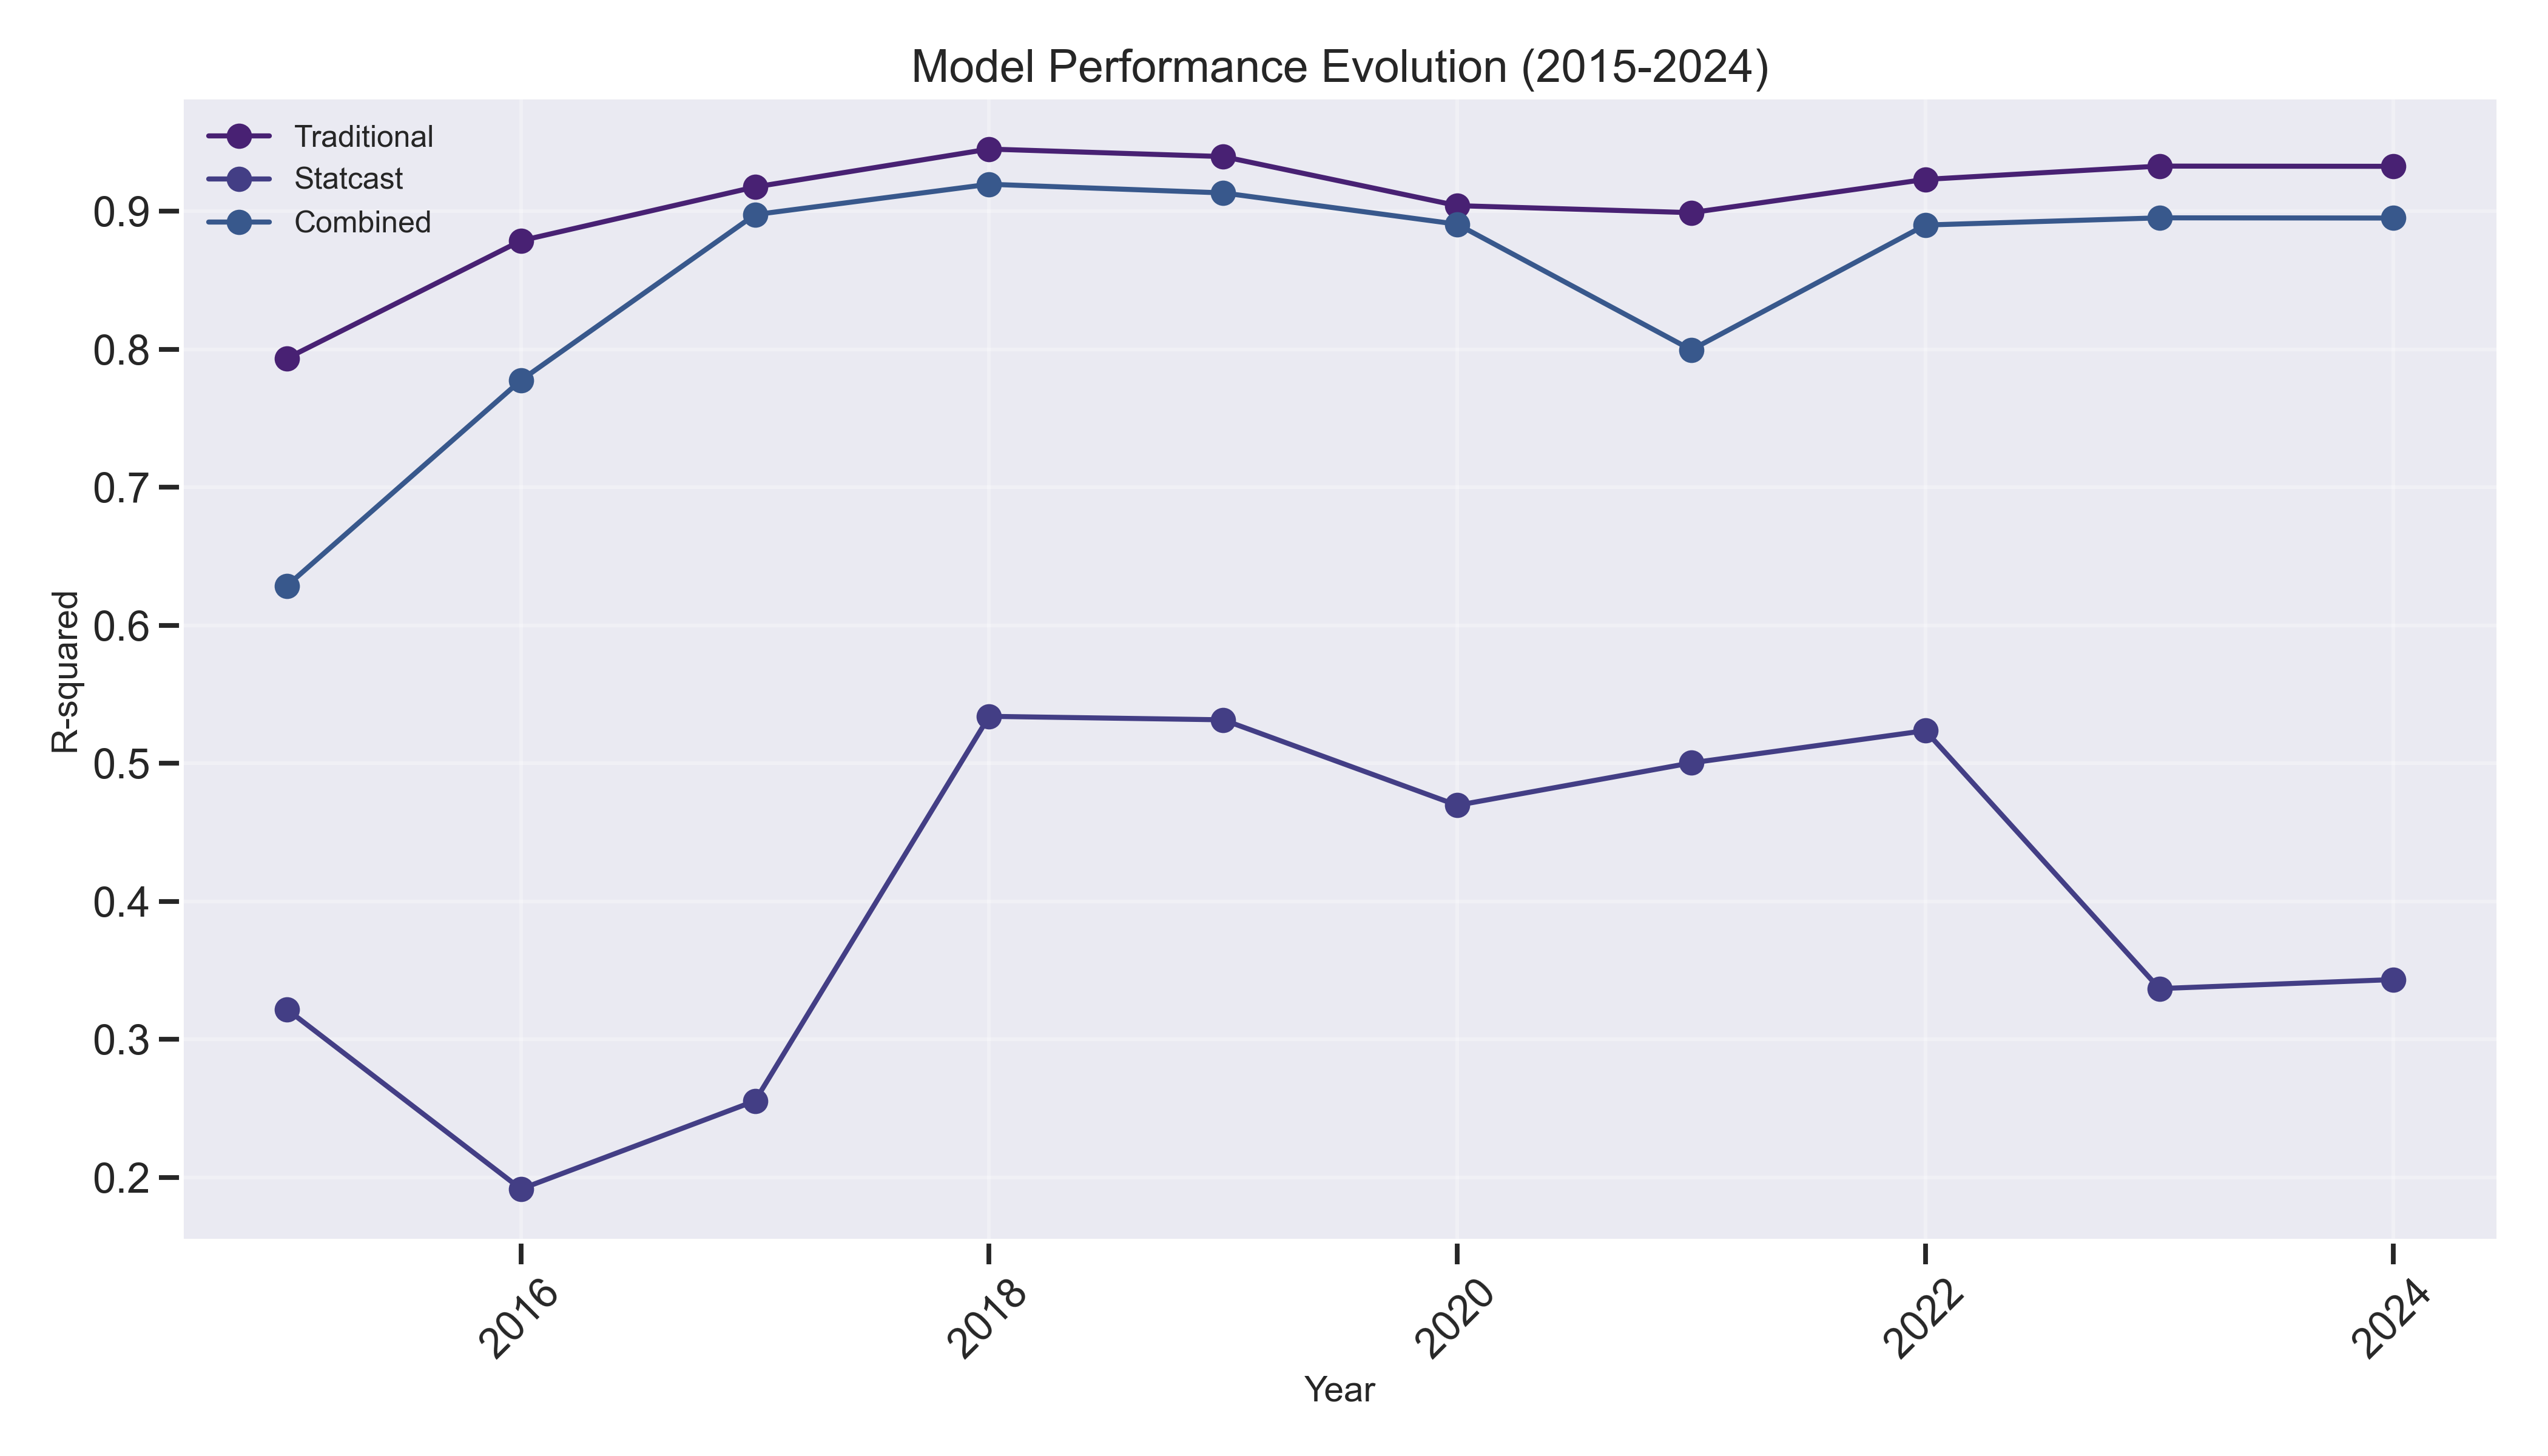 Figure 2: Model Performance Evolution (2015-2024)
The traditional model achieved an exceptionally high R-squared value of 0.955 (which means traditional metrics model explains 95.5% of the variance in team run production). Within this model, batting average was the most significant predictor with a coefficient of 5972.642 (p < 0.001), though interestingly, OBP showed a negative coefficient of -2486.658 (p < 0.001), and SLG also had a negative coefficient of -866.524 (p = 0.002). These counterintuitive coefficients likely result from multicollinearity issues, as shown in Figure 3, where strong correlations exist between AVG and OBP (r = 0.74), AVG and SLG (r = 0.71), and OBP and SLG (r = 0.81).
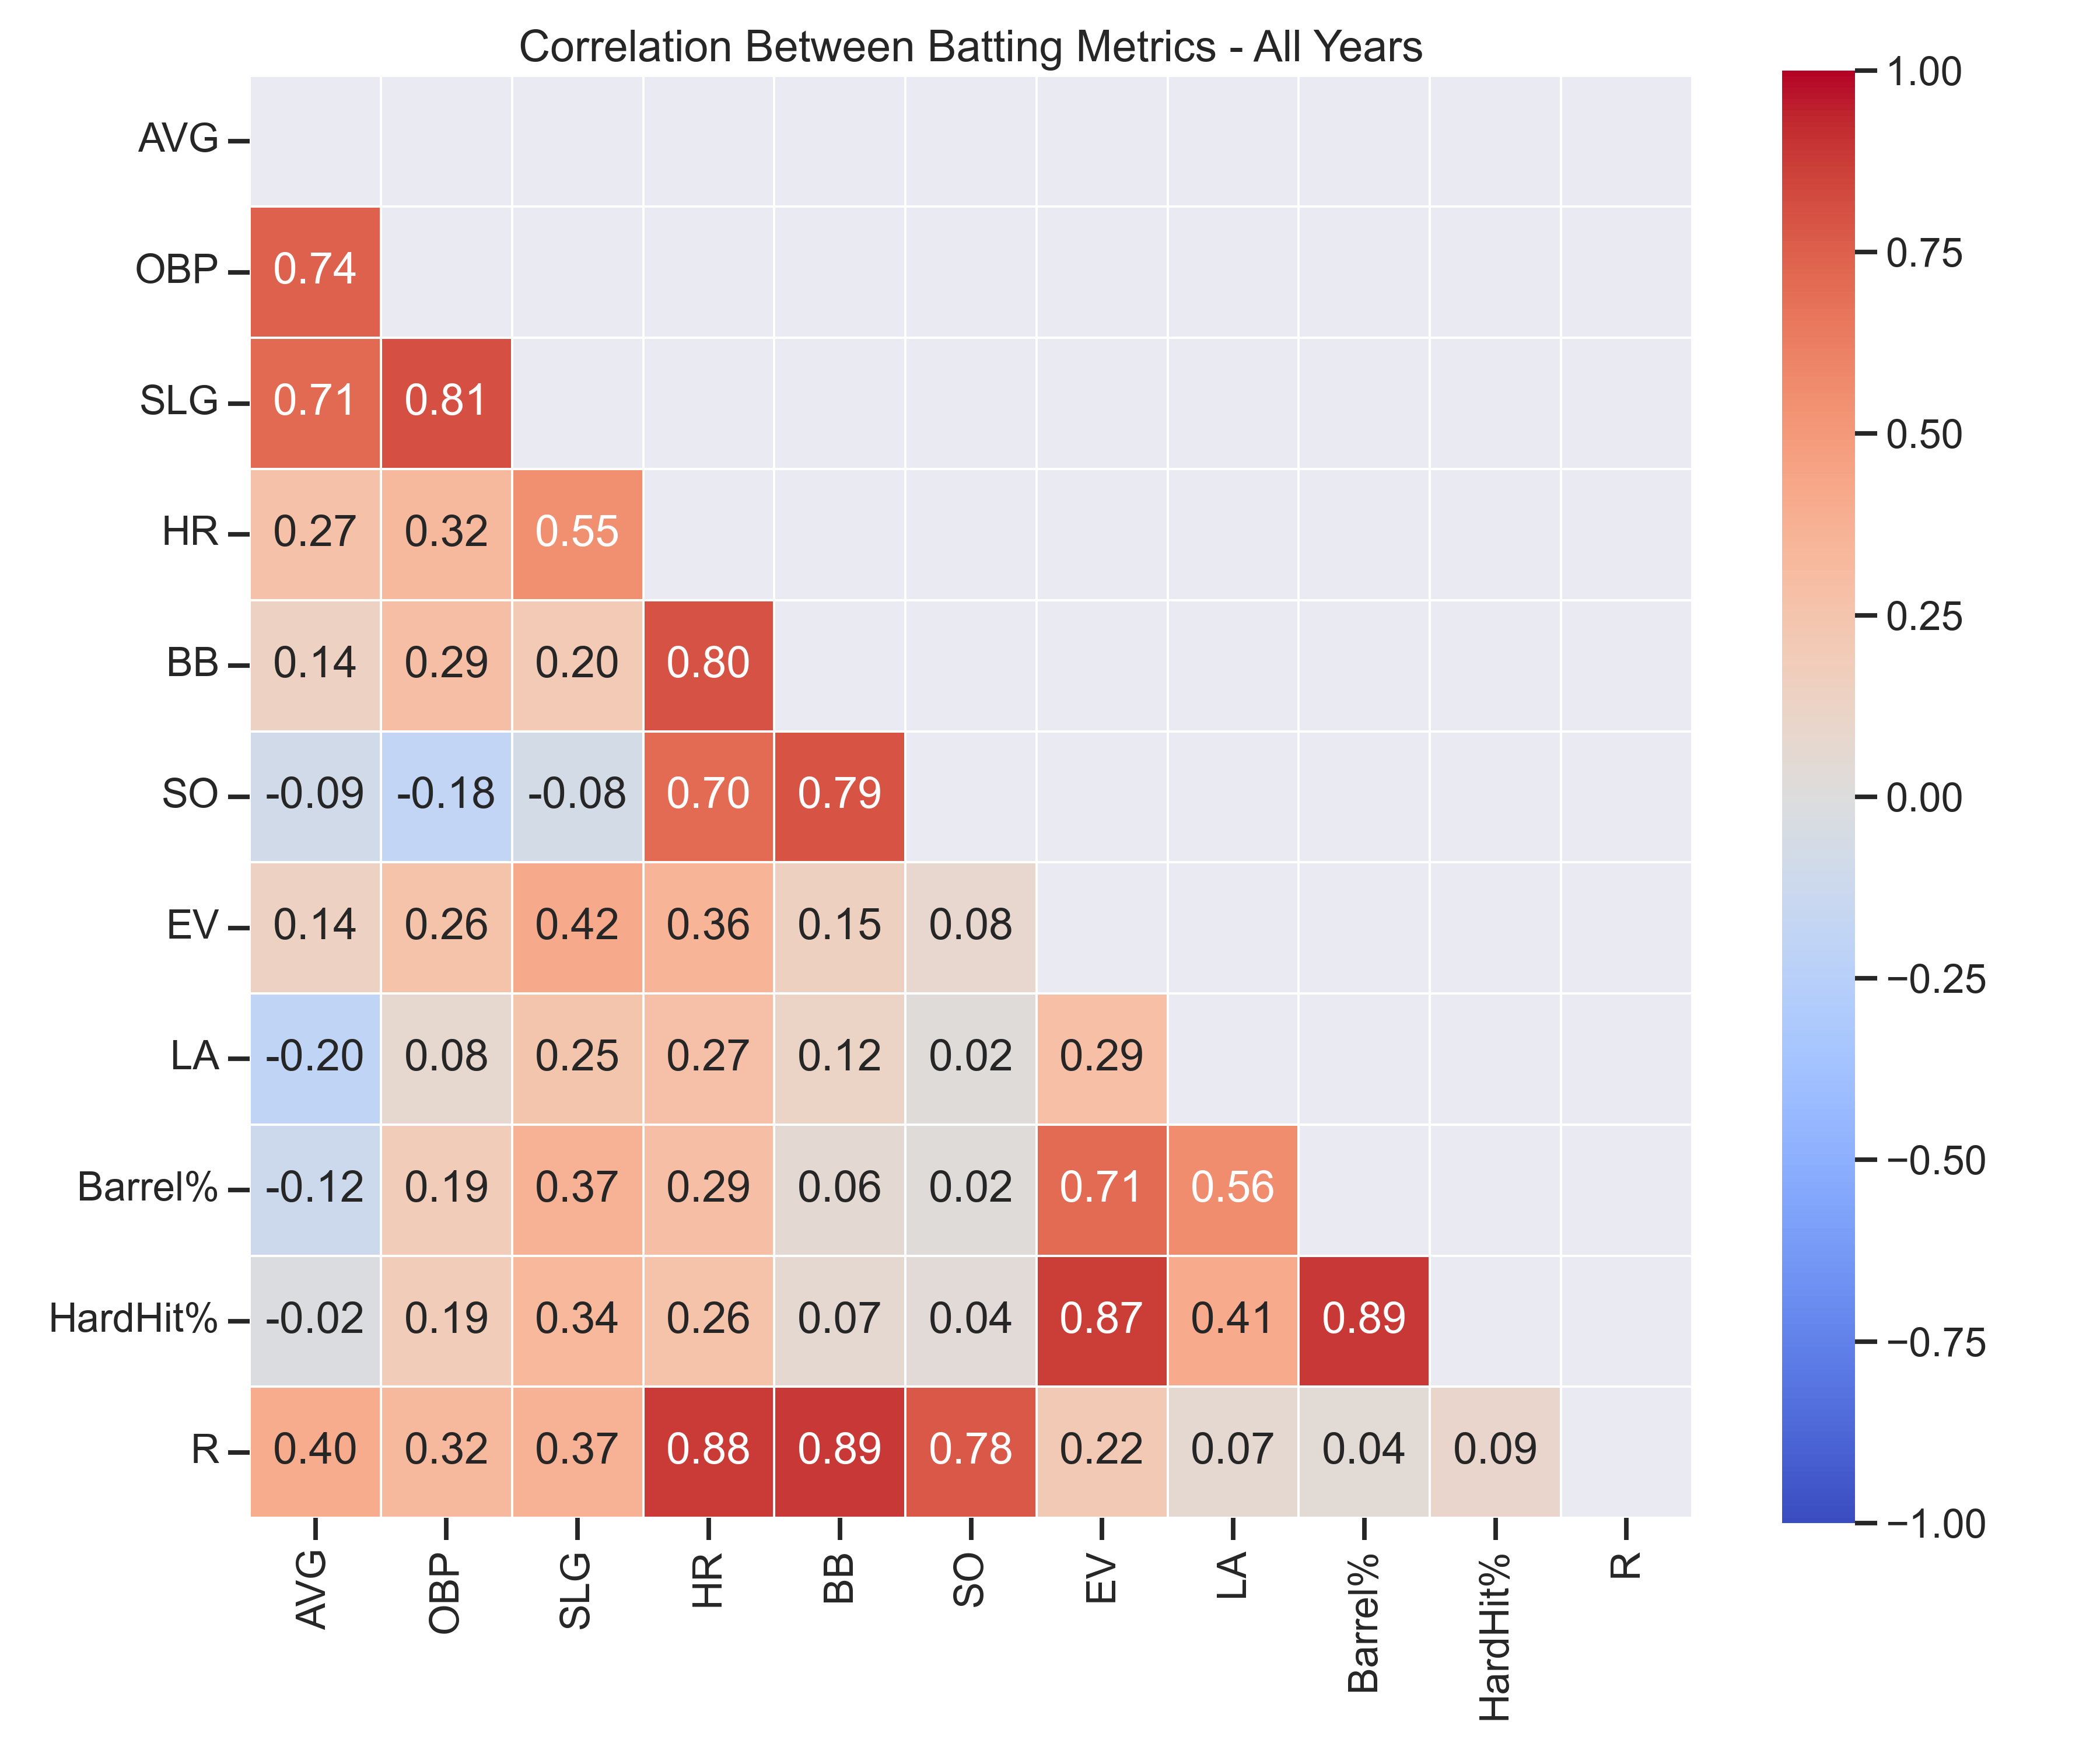 Figure 3: Correlation Between Batting Metrics - All Years
The Statcast model showed an R-squared value of just 0.091, which means this model have significantly lower explanatory power. Within this model, exit velocity was the only significant predictor (coefficient = 99.840, p < 0.001). This suggests that the quality of contact measured by Statcast provides some information about offensive potential, but it captures a relatively small portion of what drives run production. The combined model showed performance intermediate between the traditional and Statcast models, though much closer to the traditional model’s effectiveness. This indicates that Statcast metrics do not represent a huge breakthrough in predicting offensive production at the team level but only provide additional information beyond traditional statistics.
The longitudinal analysis of these relationships, shown in Figure 4, demonstrates trends in how various metrics correlate with run production over time. The figure shows that the relative importance of different metrics fluctuated somewhat from year to year. Traditional statistics, particularly BB, HR, and the traditional slash line statistics (AVG, OBP, SLG), consistently outperformed Statcast metrics throughout the entire study period.
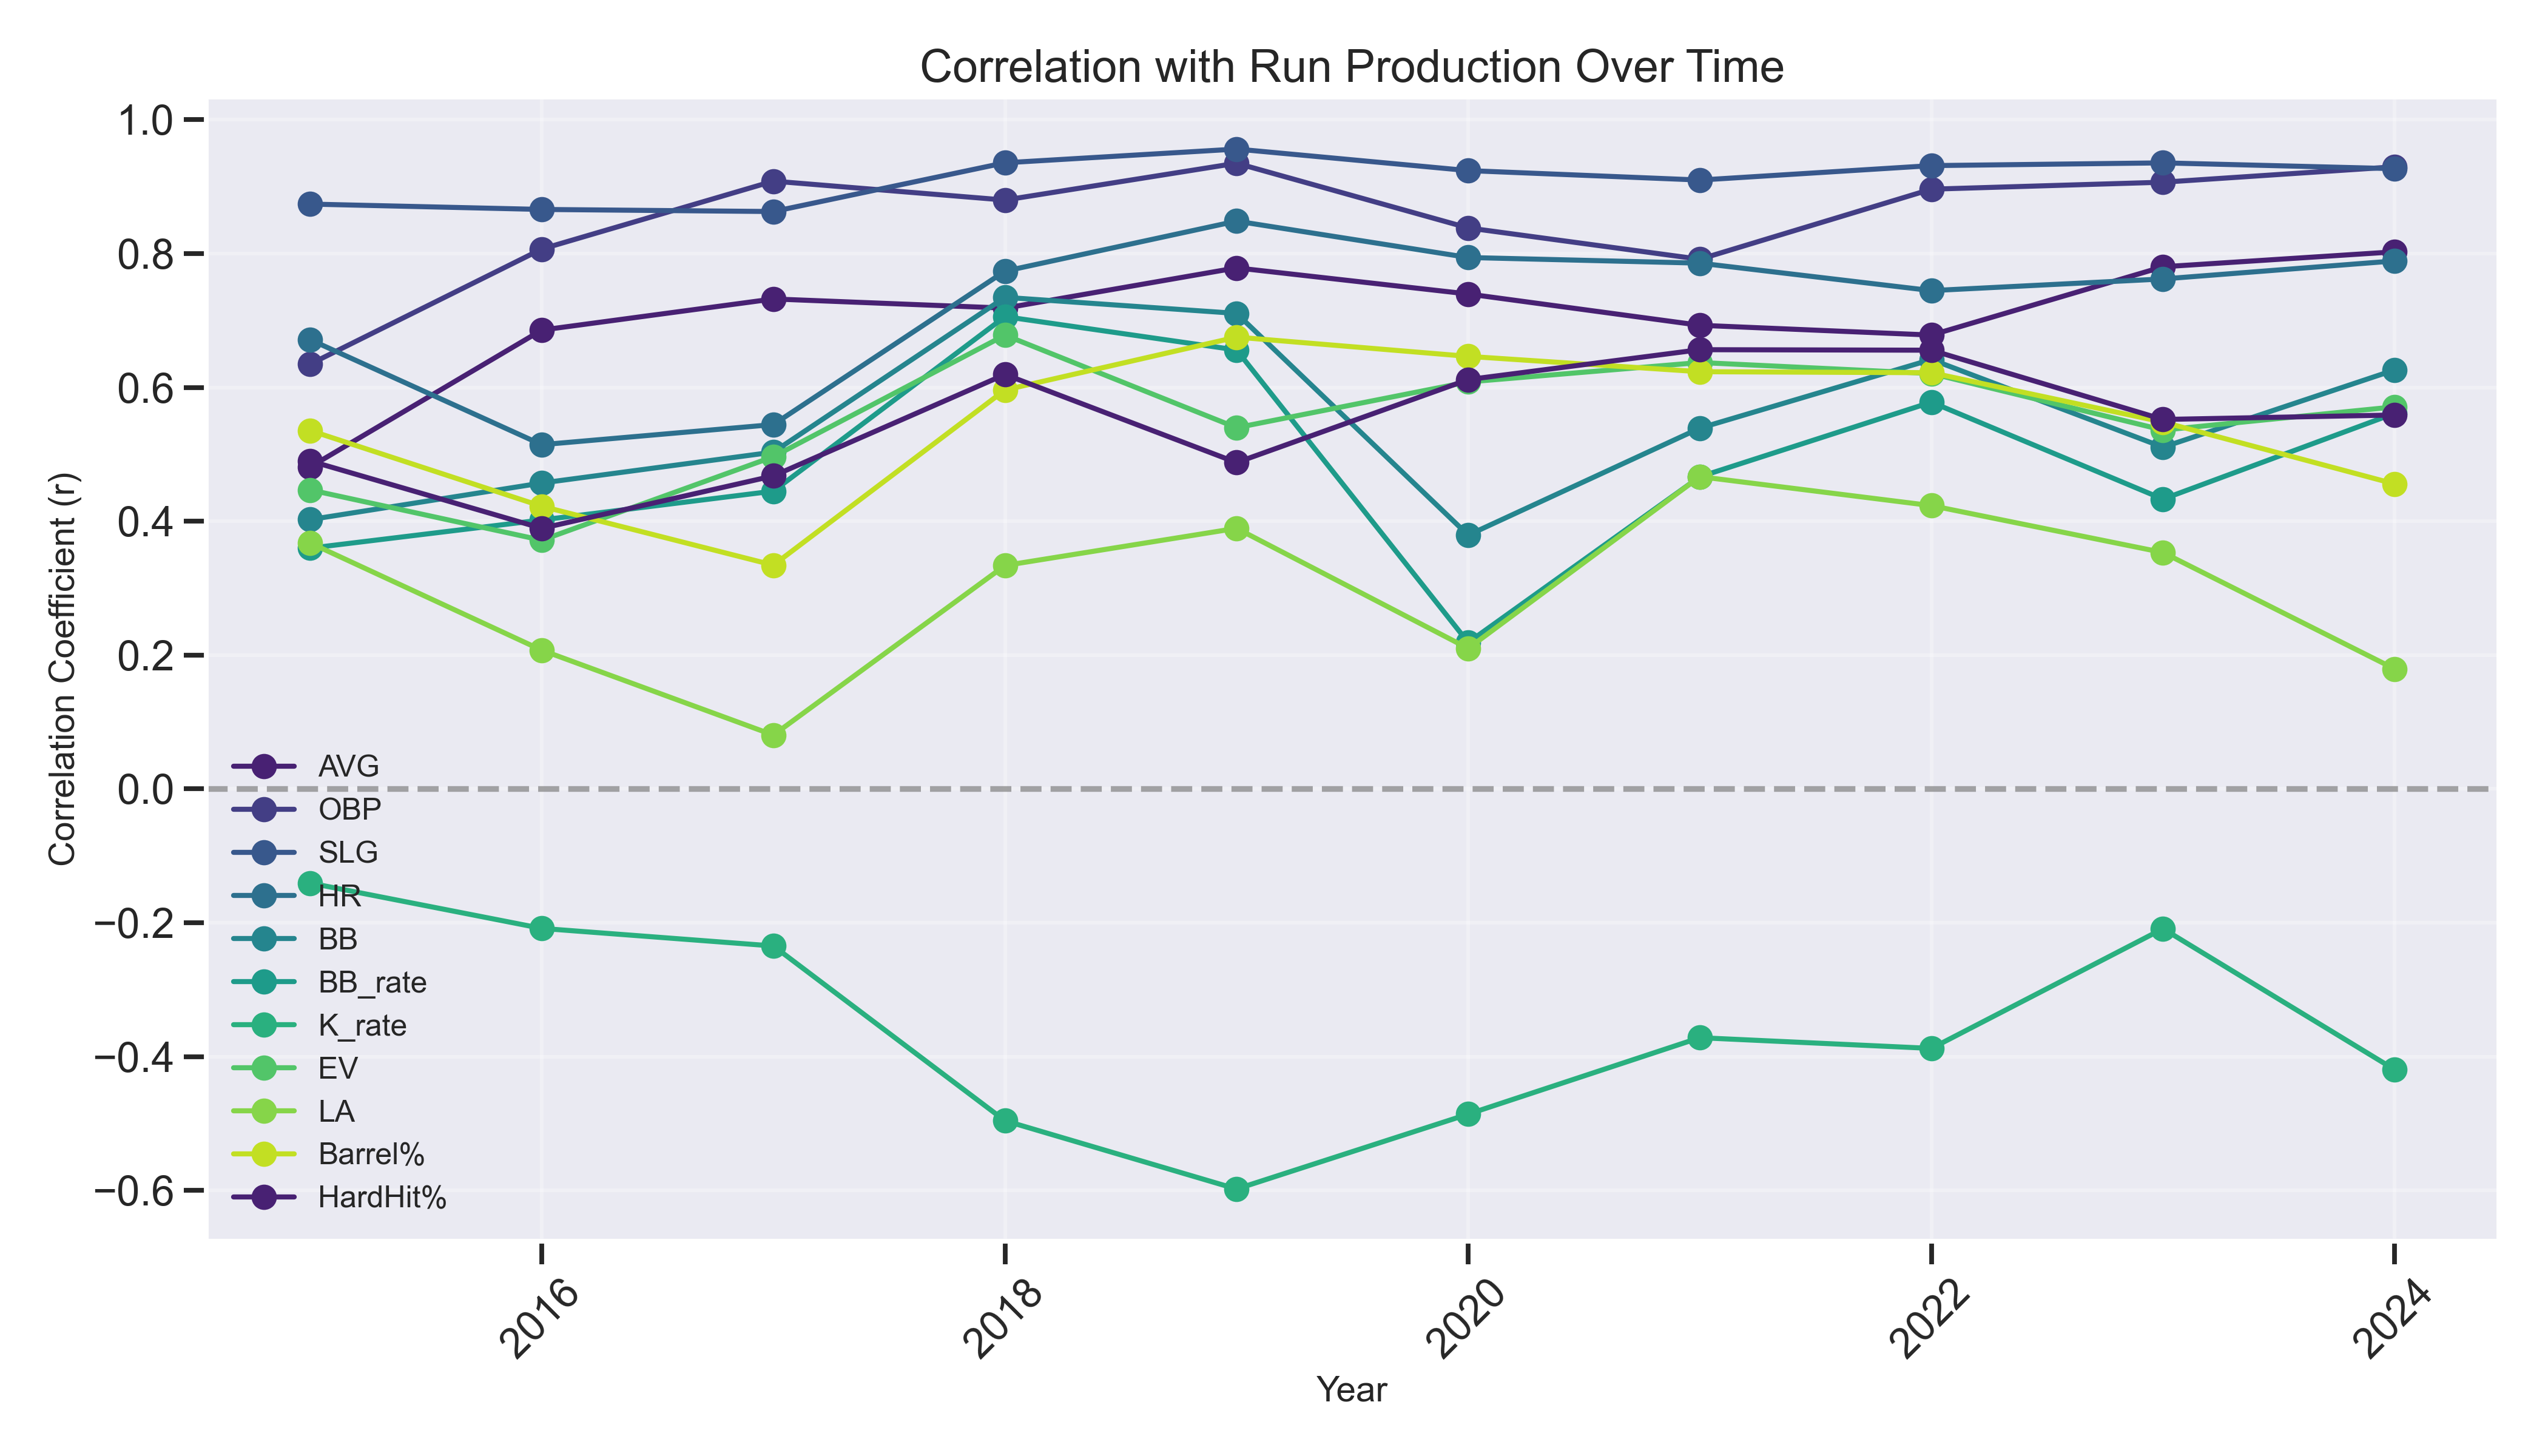 Figure 4: Correlation with Run Production Over Time
One notable trend is the negative correlation between strikeout rate (K_rate) and run production. Indeed, the negative correlation strengthened over time (reaching approximately r = -0.4 by 2024). This indicates the growing cost of strikeouts in the modern game. Another interesting observation is the relative stability of most correlations despite some rule changes during this period, such as the introduction of the universal designated hitter, pitch clock, and restrictions on defensive shifts. This stability suggests that the fundamental relationships between batting outcomes and run production remain consistent even as the strategic environment of the game evolves.
These results challenge several widely held beliefs in modern baseball analysis. The relatively weak correlation between Statcast metrics and run production contradicts the growing emphasis on “quality of contact” metrics in player evaluation. Metrics such as exit velocity and barrel rate provide useful information about a batter’s raw physical ability, but they have been shown to be less directly linked to team offensive success than traditional outcome-based statistics. This aligns well with Albert’s (2016) decomposition approach, which found that certain component metrics (like home run rate) are more stable and predictive than others. The finding that walks and home runs show the strongest correlations with run production supports Pinheiro and Szymanski’s (2022) conclusion that “the compensation of free agents reliably reflects the run value contribution of each player, regardless of the source of those contributions (walks, singles, and home runs)” (p. 1046).
The fact that traditional statistical models perform well in predicting scored runs suggests that, despite Statcast providing intriguing insights into the mechanical aspects of batting, traditional outcome-based metrics are more directly linked to the ultimate goal of scoring runs. This finding does not undermine the value of Statcast data for player development, as documented by Lindbergh and Sawchik (2019) in their analyses of how players have transformed their swings and approaches based on Statcast feedback. Rather, it suggests that these physical improvements matter primarily to the extent that they translate into traditional outcomes like hits, walks, and home runs. The highest-scoring team in 2023, the Atlanta Braves (947 runs), effectively combined high contact rates with powerful hitting, implying that the optimal approach is not to choose between traditional and modern philosophies but to integrate both.
Conclusion
This study identified several key batting metrics that demonstrated a consistent strong correlation with team scoring during the Statcast era (2015–2024). Despite the increasing emphasis on advanced metrics in MLB front offices, traditional statistical metrics, particularly walks (BB, r = 0.890) and home runs (HR, r = 0.875), remain the most reliable indicators of offensive power. Traditional metric regression models achieved very high levels of explanatory power (R-squared = 0.955) and significantly outperformed models based solely on Statcast metrics. While physical attributes measured by Statcast provide valuable insights into player capabilities and development potential, they translate to run production primarily through their contribution to traditional offensive outcomes.
When interpreting these results, several limitations must be acknowledged. First, team-level analysis may obscure important individual-level relationships between batting metrics and offensive contributions. Different types of batters may contribute to team success through distinct pathways, and aggregating at the team level can obscure these nuanced relationships. Second, high multicollinearity among relevant metrics (e.g., the 0.890 correlation between Barrel% and HardHit%) complicates the interpretation of individual regression coefficients. Specifically, high multicollinearity makes it difficult to explain the counterintuitive negative coefficients of OBP and SLG in traditional models. Third, this study focuses solely on offensive metrics without considering base running plays, such as stolen bases, which can significantly influence run production not captured by batting statistics.
Future research can explore several promising directions based on these findings. First, expanding the analysis to player-level data could reveal how the relationship between batting metrics and offensive contributions varies across player types. Such study can contribute to the identification of optimal evaluation frameworks for diverse offensive profiles. Second, incorporating situational context (such as high-leverage situations, performance against elite pitching, or production with runners in scoring position) would provide deeper insight into which metrics predict offensive success in the moments that most directly impact winning. Third, examining how defensive positioning and strategies have affected the value of different batting approaches throughout the Statcast era would enhance our understanding of the complex dynamics between offense and defense. Finally, integrating physical and anthropometric data, similar to Kohn et al.’s (2024) approach with collegiate players, could bridge the gap between physical capabilities and on-field outcomes, potentially identifying developmental pathways that most reliably translate raw physical tools into productive offensive performance at the major league level.
References
-
Albert, J. (2016). Improved component predictions of batting and pitching measures. Journal of Quantitative Analysis in Sports, 12(2), 73-85.
-
Baumer, B., & Zimbalist, A. (2014). The sabermetric revolution: Assessing the growth of analytics in baseball. University of Pennsylvania Press.
-
Kohn, J. N., Lochhead, L., Feng, J., Bobb, R., & Appelbaum, L. G. (2024). Strength, speed, and anthropometric predictors of in-game batting performance in baseball. Journal of Sports Sciences, 42(8), 720-727.
-
Lindbergh, B., & Sawchik, T. (2019). The MVP machine: How baseball’s new nonconformists are using data to build better players. Basic Books.
-
Pinheiro, R., & Szymanski, S. (2022). All runs are created equal: labor market efficiency in major league baseball. Journal of Sports Economics, 23(8), 1046-1075.
-
Wulff, S. S., & De Silva, W. P. (2022). A multi-criteria approach for evaluating major league baseball batting performance. Journal of Sports Analytics, 8(2), 85-98.